

In the intricate web of a city’s landscape, finding the optimal location in proximity to specific points can be likened to solving a geometric puzzle. Imagine having two locations, A and B, each with its own aesthetic attraction, and you standing at a point P wondering, “How do I reside nearer to A than to B, or nearer to B than to A?” The answer lies in the fascinating world of Voronoi diagrams.
Thank you for reading this post, don't forget to subscribe!
Geometrically speaking, if we draw the perpendicular bisector of the line segment connecting A and B, it magically carves the city into two distinct regions. Any arbitrary point in the region of A is inherently closer to A than to B. Similarly, a point in the region of B maintains a closer bond with B than with A.

But what happens when the equation involves not just two, but three, four, or numerous locations? Here, the magic of Voronoi diagrams unfolds. The concept of perpendicular bisectors still reigns supreme, and as we employ them for each location, different regions emerges, intricately designed to conform to the spatial dynamics of the given points..
Enter Georgy Voronoi, the mathematician behind this mesmerizing geometric phenomenon. The shape formed by these regions is aptly named the Voronoi Diagram, a testament to Voronoi’s insightful contribution to the world of mathematics. In this article, we’ll explore the intricacies of Voronoi diagrams, examining their practical applications that render them indispensable across various fields. Additionally, we’ll delve into the process of drawing them.
Introduction
The illustration presented below exemplifies a Voronoi Diagram. Each distinctive color-coded region signifies the collection of points closest to the displayed location within it, surpassing the proximity to any other location.
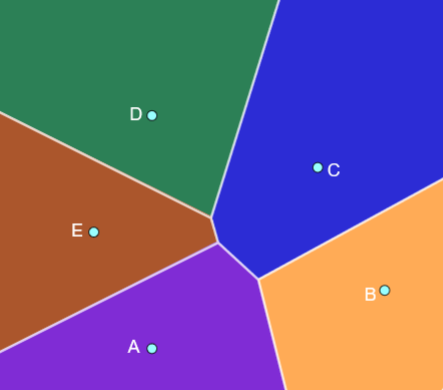
For example, points in the green region are closer to the chosen point D inside than to any other location in the plane. The chosen points are called sites and the regions formed are called cells. The lines separating any two cells (called boundaries) are the perpendicular bisectors of the segments connecting adjacent sites. In the diagram, the blue and the green cells are separated by the perpendicular bisector of DC.
Drawing a Voronoi Diagram
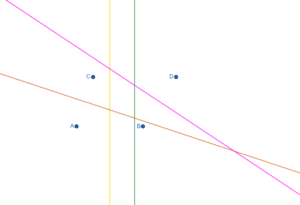
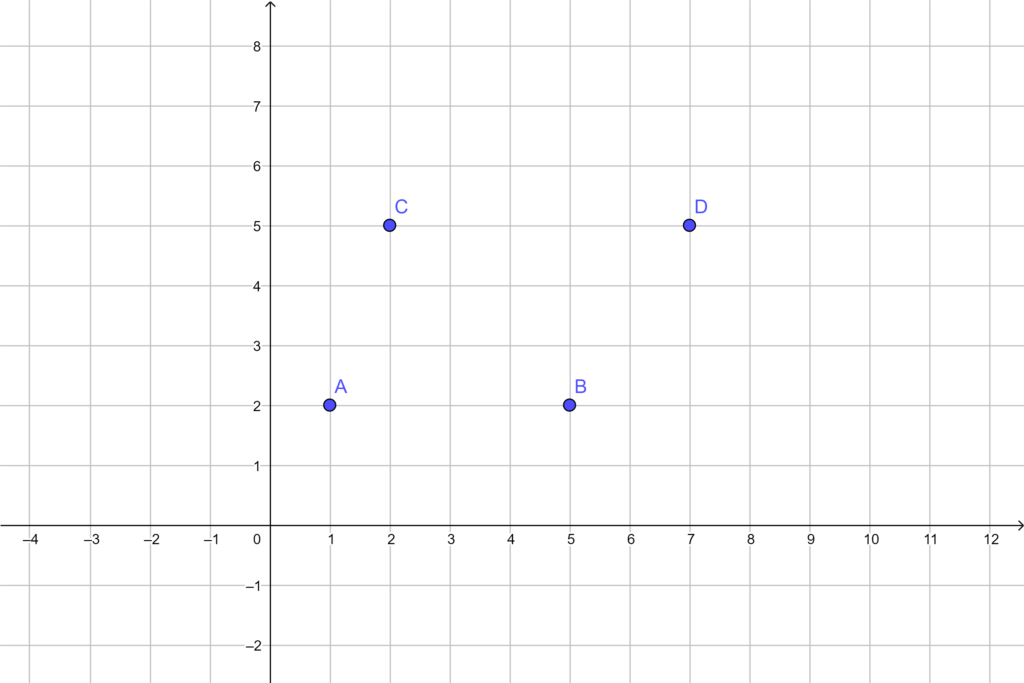
The optimal method involves concurrently sketching all the perpendicular bisectors to separate the cells. Let’s consider four sites: A, B, C, and D, for which we aim to construct a Voronoi diagram. The following steps should be undertaken to accomplish this task.
- Locate the positions of each site. Draw perpendicular bisectors of segments joining each pair of adjacent sites.
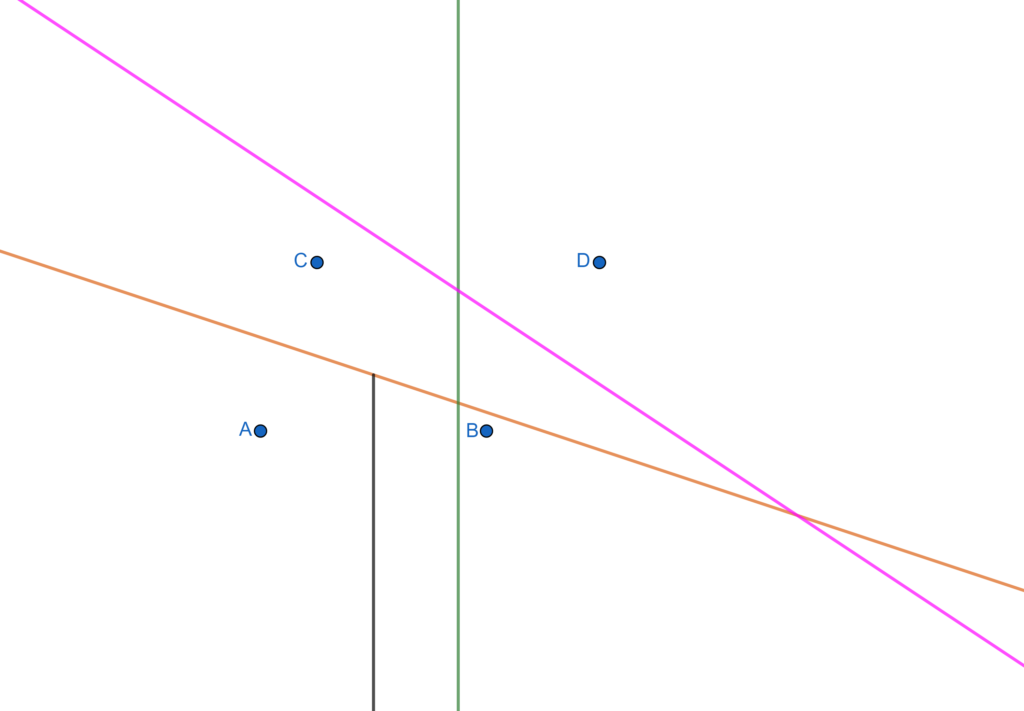
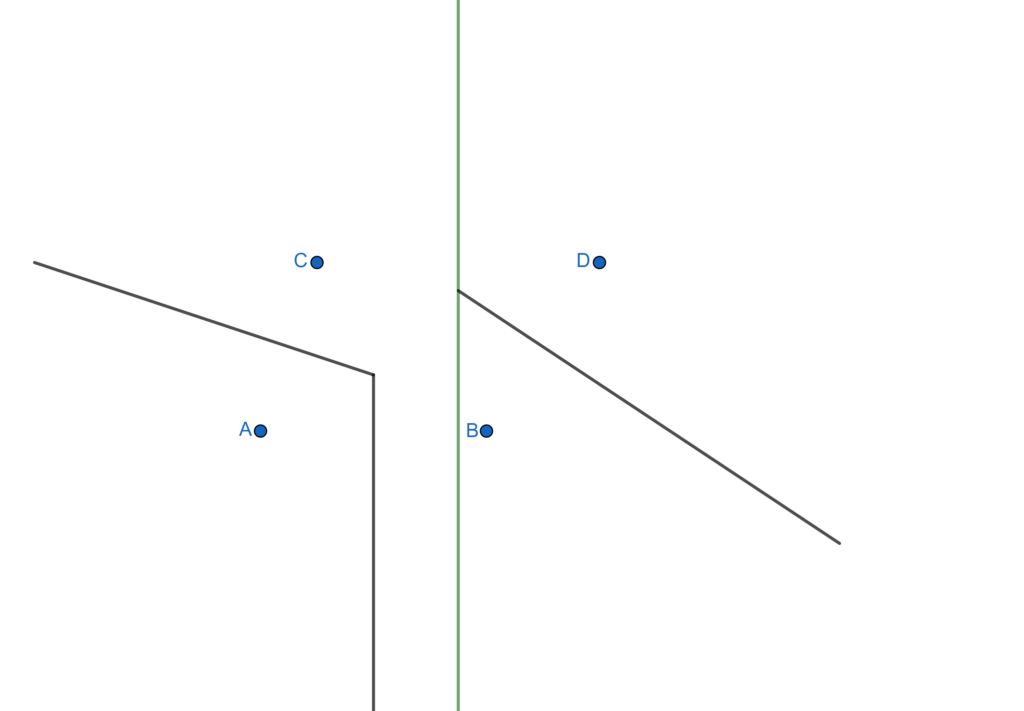
- Now we will work on each perpendicular bisectors carefully to construct cells. Let us start with the perpendicular bisector of sites A and B (the yellow vertical line in the figure). Select the portion of the line that is clearly seen dividing the two sites until it hits any other perpendicular bisector. And exclude the portion that interferes the region of other sites. In the figure below the dark black vertical line (imposed over the yellow line) is selected portion. And the interfering is erased.
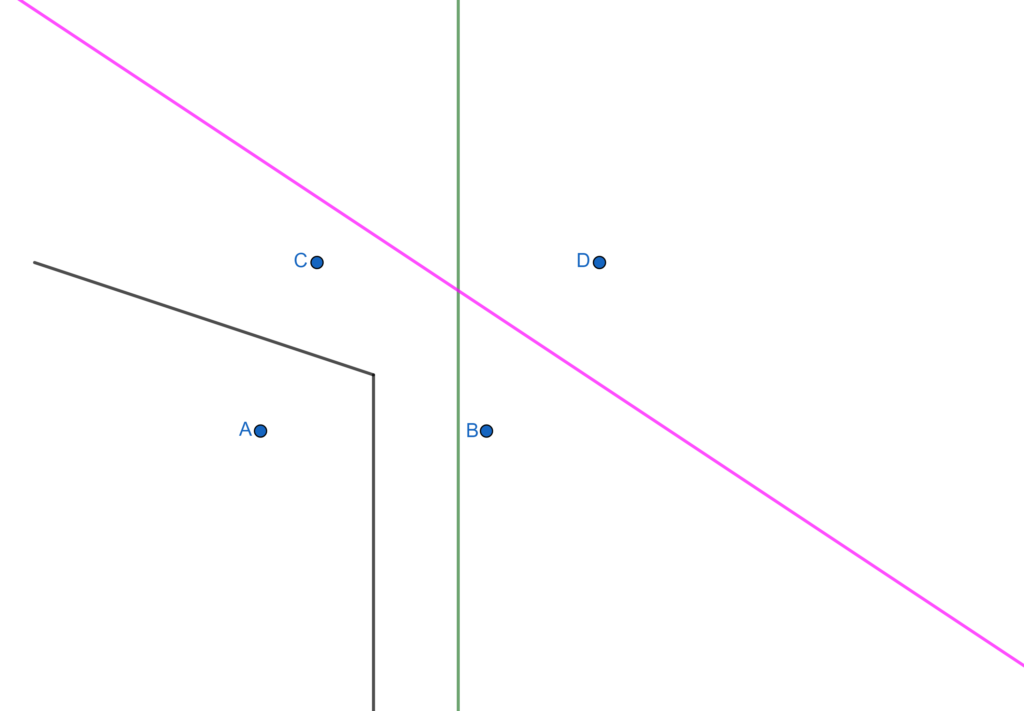
- Using similar steps we work on perpendicular bisector of the joining of the sites A and C to get the following.
- Moving to the perpendicular bisector of the joining of the sites B and D we get this.
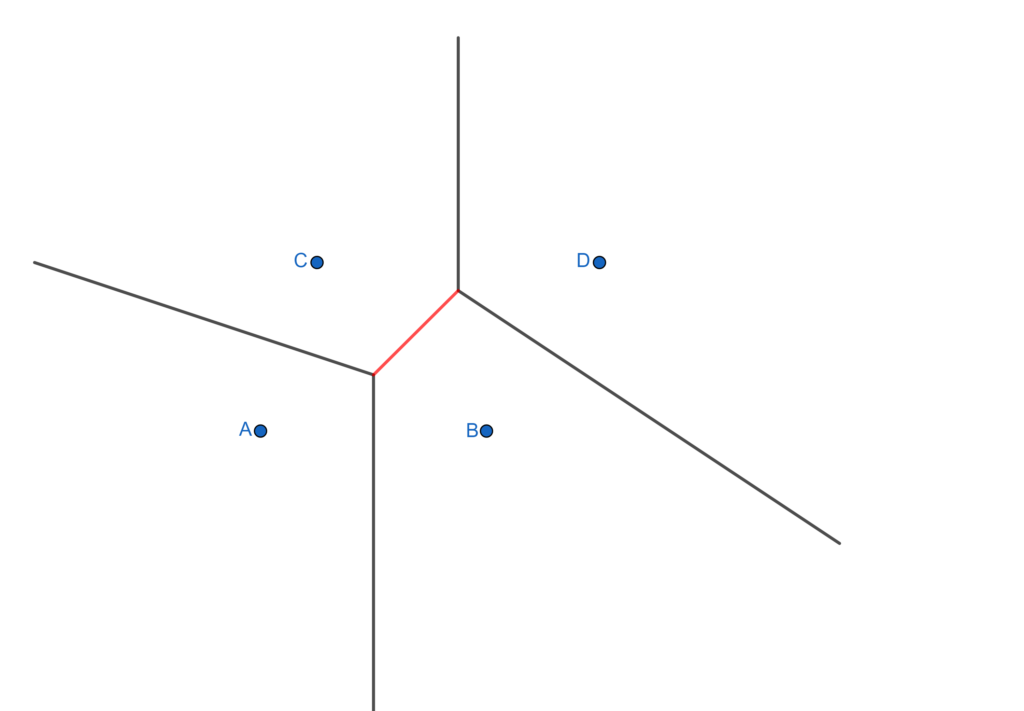
- And for the last green one we will apply the similar steps to get. And and extra step of connecting the vertices (by an orange segment in the middle) completes the Voronoi diagram.
Using tools to draw Voronoi Diagram
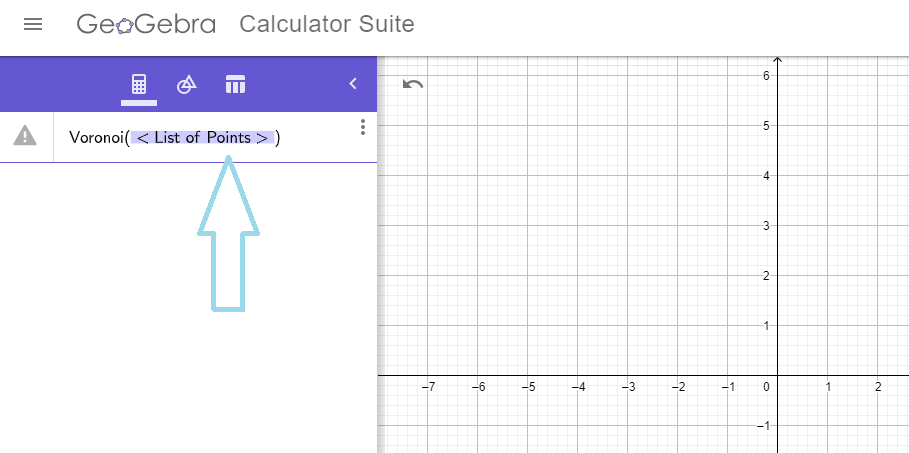
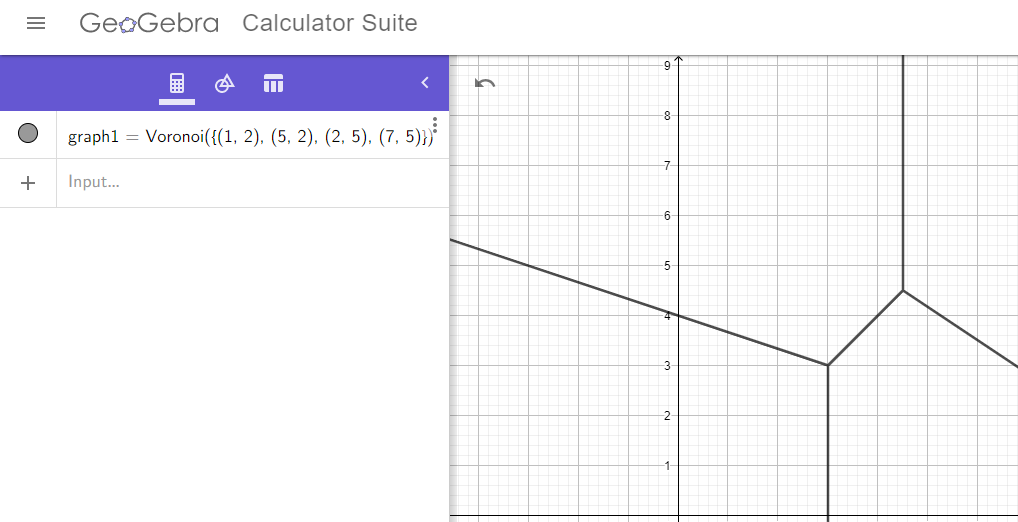
A perpendicular bisector can be created either by utilizing a compass or by determining its equation through coordinate geometry and subsequently sketching it. However, this process can be laborious and time-consuming. Fortunately, various interactive geometry software options enable users to effortlessly ascertain the equation of perpendicular bisectors and draw them directly. Two such user-friendly and free programs are GeoGebra and Desmos. These tools simplify the entire procedure. To draw a Voronoi Diagram, one simply needs to input “Voronoi,” and the software will prompt for a list of points (Of course! the co-ordinates of the points must be given. In illustration, the points taken are \(A (1,2)\), \(B(5,2)\), \(C(2,5)\), and \(D(7,5)\)). After entering the points, the software will generate the diagram. It’s that straightforward.
Voronoi in Nature
Voronoi patterns, or tessellations, manifest ubiquitously in nature. Examples include honeycomb cells, distinct brown patches on a giraffe’s fur, intricately arranged polygonal patterns on leaves, and the wings of a dragonfly, among others.

Application of Voronoi Diagram
The toxic waste dump problems
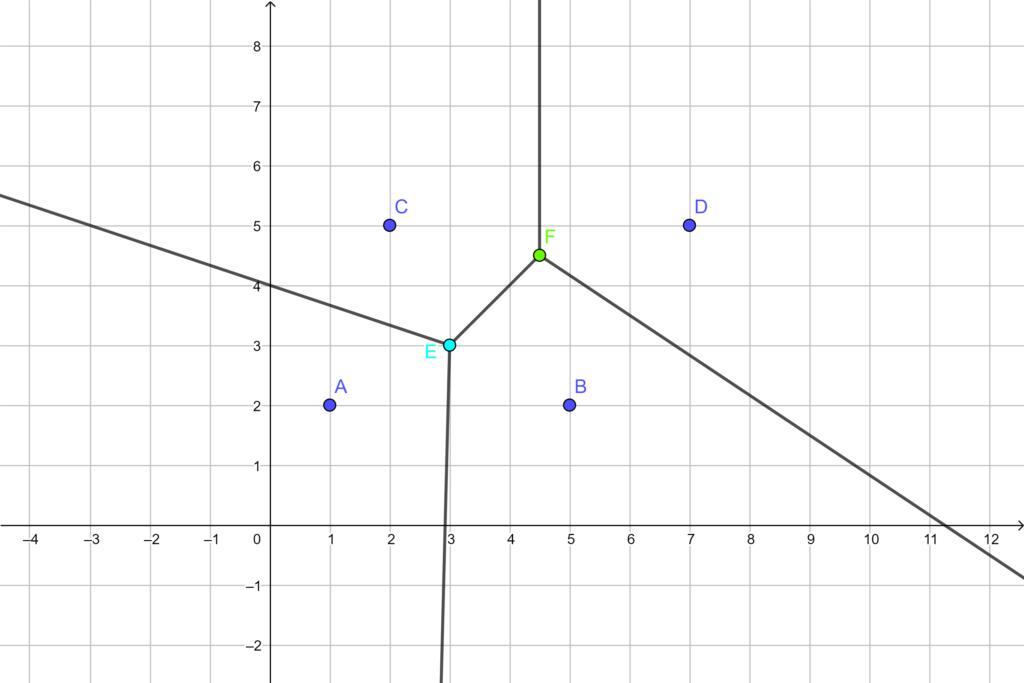
Now it is easy to verify (and observe) that the vertex $E$ is equidistant from the sites A, B, and C. In fact, E is the center of the circle passing through the sites A, B, and C. We find the length of any of the radii. So. \[AE = BE = CE = \sqrt{(3-2)^2 + (3-5)^2} = 2.24 \]Similarly, the vertex F is equidistant from the sites B, C, and F. Thus it will be center of the circle passing through these three sites. So, \[FC=FB=FD= \sqrt{(4.5-7)^2 + (4.5-5)^2} = 2.57 \]
Since, $2.57 > 2.24$, the vertex F is the appropriate position to dump the waste so that it stays as far as possible from the habitations.
Lett us understand by the following diagram with circles.
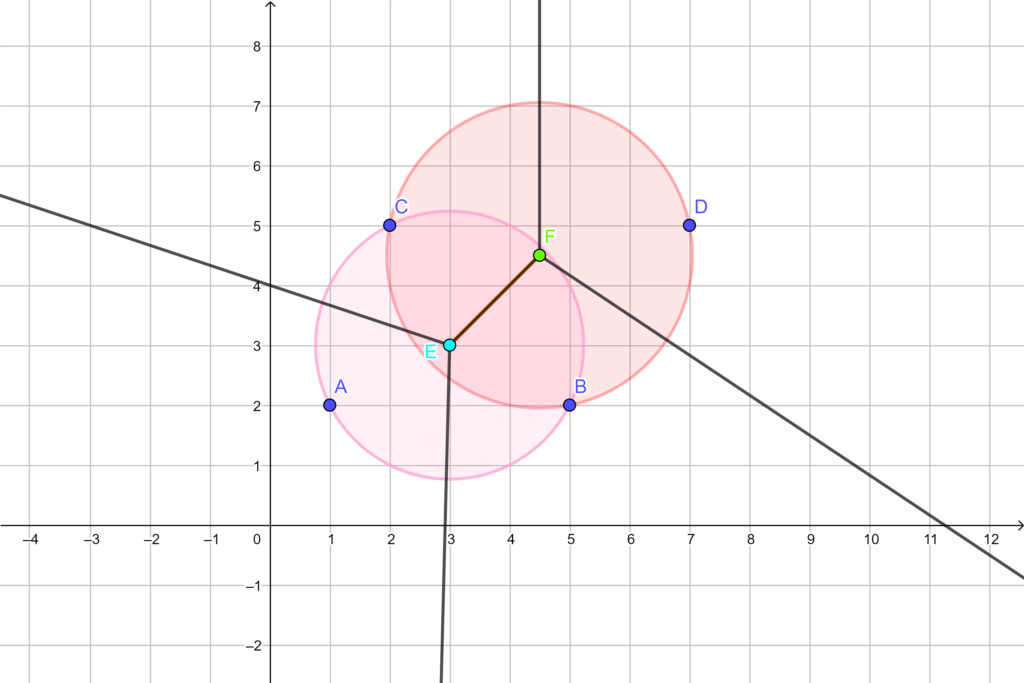
If the waste is dumped at E it will be 2.24 km away from each of the sites A, B, and C. But there is the position F which is 2.57 km away from B and C. Thus F is the correct choice.
Key: While referred to as the “Toxic waste dump problem,” it is more commonly applied to the strategic placement of shops or stores. The goal is to position them in a way that maximizes the distance from all other shops or stores of the same type in the locality. In such scenarios, the vertex that defines the larger circle is the point farthest from all the designated sites.
This geometric approach proves invaluable in urban planning and decision-making processes, allowing for efficient and optimized spatial arrangements in various real-world situations.
Stay Mathactive! 🙏
Comments are closed.